
Online Business Valuation Multiples by Business Type (2026 Data)
A SaaS business making $50,000 a year in profit was listed at about $158,500 in the typical 2024 to 2026 sale on a large US marketplace for websites and online stores. A YouTube channel making the same $50,000 was listed at $100,000. Same profit, $58,500 apart, and the only thing that changed was what kind of business it was.
Those figures come from 2,667 online businesses first listed on that marketplace between 2014 and August 2026 that went on to sell, pulled from the marketplace's public listings data on October 6, 2026. Every number below is an asking multiple: annual seller's discretionary earnings (SDE) divided into the listing price. On that marketplace the listing price is the most a buyer can pay in an all-cash deal, so the final price on each of these sales was the figure shown or lower, plus stock for inventory businesses.
If you haven't worked out your SDE yet, how to value an online business walks through it line by line. The tables here give you the multiple to put against it.
Multiples by business type, 2024 to 2026
389 businesses, all first listed from January 2024. Types with under ten sales are left out.
| Business type | Sales since 2024 | A quarter asked under | Median | A quarter asked over | Median, 2014 to 2026 |
|---|---|---|---|---|---|
| SaaS | 13 | 2.42x | 3.17x | 3.50x | 3.33x |
| Subscription | 10 | 2.58x | 3.12x | 3.33x | 3.12x |
| Amazon Merch | 13 | 2.50x | 2.83x | 2.92x | 2.66x |
| Amazon KDP | 27 | 2.33x | 2.75x | 2.92x | 2.83x |
| Display advertising | 43 | 2.21x | 2.67x | 3.00x | 2.67x |
| Amazon FBA | 145 | 2.17x | 2.58x | 3.00x | 2.67x |
| Ecommerce (own store) | 34 | 2.00x | 2.50x | 2.96x | 2.33x |
| Agency | 11 | 1.58x | 2.33x | 2.46x | 2.33x (none before 2024) |
| Affiliate | 12 | 1.90x | 2.29x | 2.77x | 2.50x |
| Dropshipping | 18 | 1.87x | 2.29x | 2.33x | 2.25x |
| YouTube | 29 | 1.50x | 2.00x | 2.42x | 2.00x |
Line all 389 up from cheapest to dearest and the one in the middle asked 2.5x annual profit. A quarter of the way in from either end you hit 2.08x and 2.92x. Two listings out of 389 asked for 4x or more. Sixty-six asked for under 2x.
If a broker or an old calculator quotes you something like "30x", that's monthly profit. Divide by 12 and you get the same 2.5x.
Offline small businesses price in the same range. BizBuySell's 2025 review of 9,586 closed sales, mostly restaurants, shops and service firms, put the average cash-flow multiple at 2.61x and the median sale price at $350,000.
Small groups move a lot with one or two sales. SaaS and subscription businesses have 13 and 10 sales in this period, so treat their medians as a direction rather than a quote, and check them against the all-years column, where SaaS has 53 sales behind it.
Recurring billing sits at the top
SaaS and subscription businesses were the only two types with medians above 3x in both columns. For example, a buyer looking at a project management tool with 400 paying teams can open the billing system and see next month's revenue before it arrives, account by account, with each team's start date and cancellation history attached.
A decade of SaaS sales, from 2016 on, runs from tools asking 2.5x to tools asking 4x and up. Picture two invoicing apps, each with 500 customers on $30 a month. One loses 2% of its customers a month (10 in the first month), the other 8% (40 in the first month). By the following year the first still bills around 390 of them and the second around 185, so the buyer of the second app is paying for a business less than half its listed size by next autumn.
Amazon KDP and Merch catalogs did better than you might expect from businesses that live entirely on one Amazon account. Take a hypothetical self-publishing catalog of 140 low-content journals: it can keep selling for years after the last title went up, with no inventory, no ads and royalties paid monthly. Since 2024 Amazon KDP businesses have had a 2.75x median, a touch above Amazon FBA brands at 2.58x.
Dropshipping stores and YouTube channels: 1.5x to 2.4x
Nine of the 18 dropshipping stores listed since 2024 asked somewhere between 1.87x and 2.33x. On a store making $50,000 a year, that whole band spans about $23,000, from $93,500 to $116,500. A store that buys from one overseas supplier and sells through one Meta ad account leaves a new owner little to change in year one.
YouTube only appears as a separate business type in listings from 2024 on, and all 29 of those channels have sold since. A quarter of them were listed at 1.5x or lower. On $50,000 of profit that is $75,000. Platform risk is the usual explanation: a channel terminated after repeated policy strikes, or monetization switched off under YouTube's inauthentic content rules, and the income stops for the new owner on day one. How much is a YouTube channel worth covers which channels end up at the top of that range and which at the bottom.
The 2021 peak and the slide since
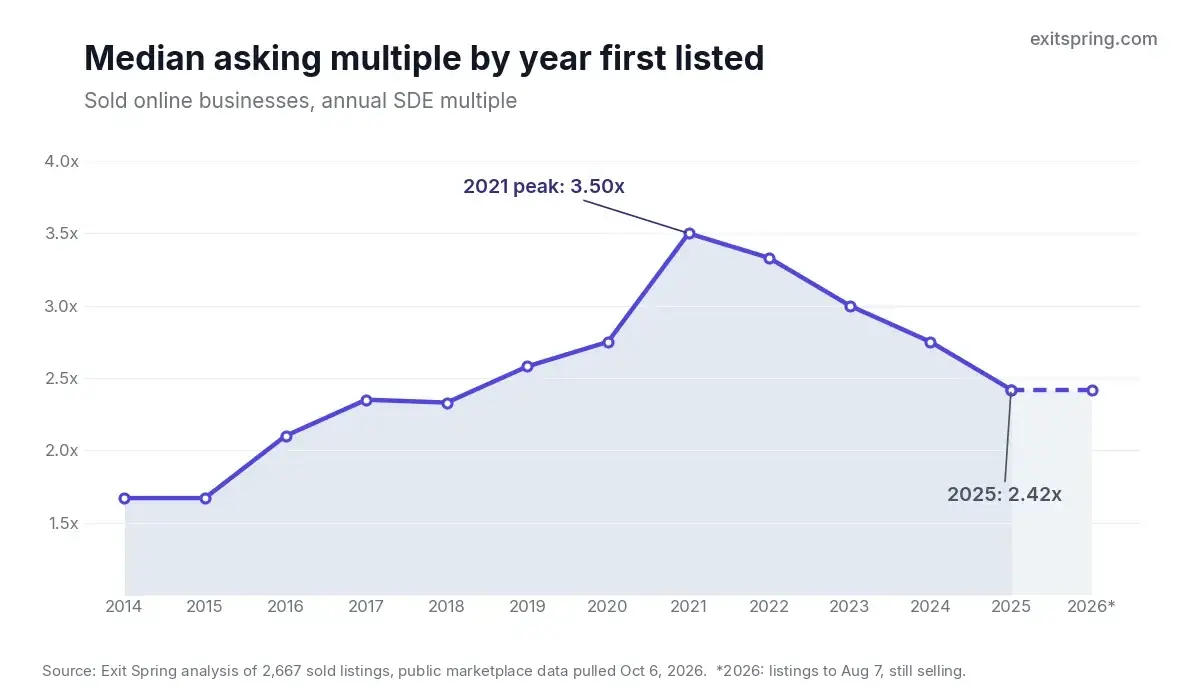
Grouped by the year a business was first listed, the median multiple climbed from 1.67x in 2014 to 2.75x in 2020, with a flat year in 2015 and a slight dip in 2018, then jumped in 2021 and has been falling since.
| Year first listed | Sold listings | Median asking multiple |
|---|---|---|
| 2019 | 260 | 2.58x |
| 2020 | 307 | 2.75x |
| 2021 | 377 | 3.50x |
| 2022 | 296 | 3.33x |
| 2023 | 159 | 3.00x |
| 2024 | 163 | 2.75x |
| 2025 | 162 | 2.42x |
| 2026 (to August) | 64 | 2.42x |
Amazon brand aggregators raised more than $12 billion in 2021 to buy FBA stores, with the Federal Reserve's benchmark rate held at 0 to 0.25% since March 2020, and buyers competed for the same listings. Of the 1,221 sold listings in this data first listed between 2021 and 2026, the 377 from 2021 alone account for almost a third.
The fall from the peak was steep in most large categories:
- Display advertising sites dropped from a 3.67x median in 2021 and 2022 to 2.67x since 2024.
- Amazon FBA stores went from 3.58x to 2.58x, a full turn of profit lower.
- Affiliate sites fell furthest, from 3.50x to 2.29x.
- SaaS lost about a turn too, from 4.16x to 3.17x.
On a $100,000-a-year FBA brand, that difference between 2021 to 2022 and now is roughly $100,000 of asking price. By January 2024, Marketplace Pulse counted more than 40 aggregators that had shut down.
Where the content sites went
In 2020, sites earning from display ads, Amazon Associates or other affiliate programs made up 54% of the businesses sold on the marketplace. Among businesses first listed in 2025, they made up 13%. So far in 2026 the share is 8%.
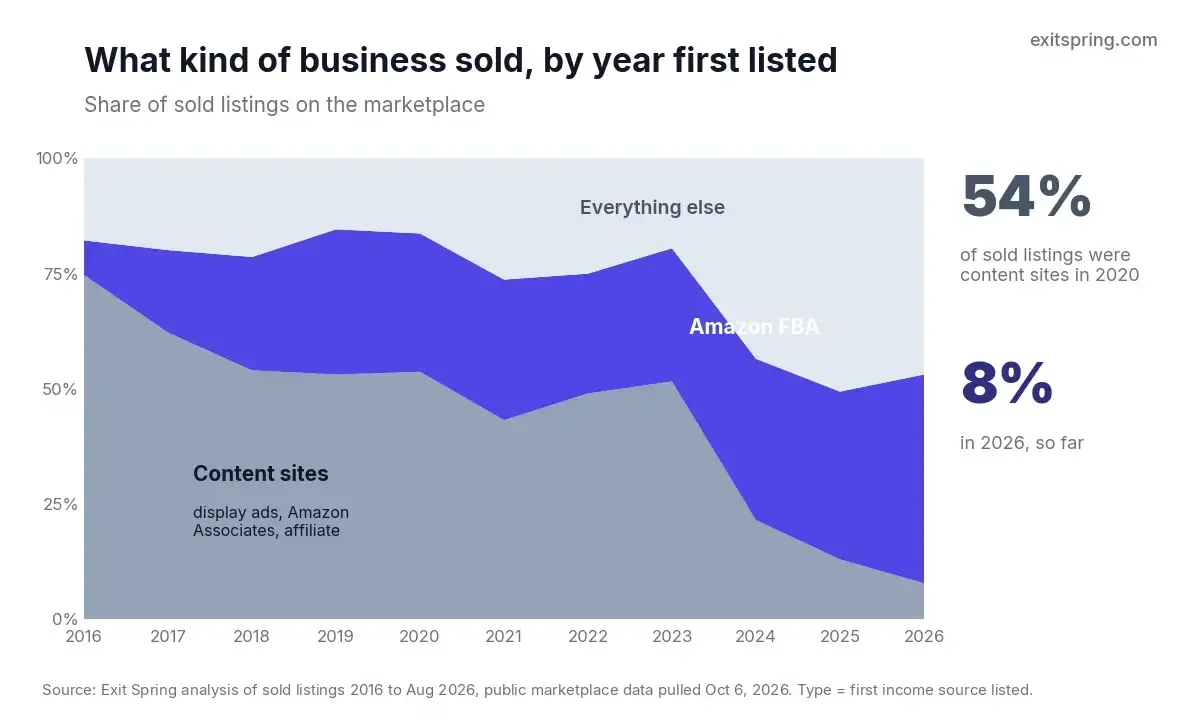
We counted 114 Amazon Associates review sites first listed in 2020 that went on to sell. From 2025 we found two. From 2026, none so far.
| When | What changed |
|---|---|
| April 21, 2020 | Amazon cut Associates commissions, furniture and home improvement from 8% to 3% and grocery from 5% to 1% |
| August 2022 to September 2023 | Google's helpful content updates, in August 2022, December 2022 and September 2023 |
| March 2024 | Google's core update and new spam policies, which Google says together cut low-quality, unoriginal content in results by 45% |
The content sites still selling are priced close to their old levels. Display advertising sites listed since 2024 have a 2.67x median, the same as their twelve-year figure. Far fewer of them reach the market, and the ones that do are likely to be sites that came through those updates with their traffic intact.
More than a third of the 389 sold listings since 2024, 145 in all, were Amazon FBA stores. The live marketplace looks much the same. When we pulled the data on October 6 there were 174 businesses for sale, 69 of them FBA. Next came 27 Shopify-style stores on their own domains, then 16 YouTube channels.
Older businesses get a better multiple
Business age showed one of the cleanest patterns in the data. These figures use listings since 2024, measured from the date a business first made money to the date it was listed.
| Age when listed | Sold listings | Median asking multiple |
|---|---|---|
| Under 2 years | 82 | 2.21x |
| 2 to 3 years | 54 | 2.33x |
| 3 to 5 years | 78 | 2.62x |
| 5 to 8 years | 99 | 2.66x |
| Over 8 years | 76 | 2.83x |
Take a store making $80,000 a year. Listed at 18 months old, the median puts it at about $176,800. The same store at six years old would be listed at about $212,800, $36,000 more for nothing but the extra history. For a 20-month-old store, waiting until just past its third birthday moves it from the 2.21x row to the 2.62x row.
Above $250,000 a year, the multiple jumps
Over twelve years there was a slow climb with size. The smallest sites, under $25,000 a year, had a 2.35x median, and the 166 businesses clearing $250,000 had a 3.33x median.
Since 2024 that climb has gone flat in the middle. A $30,000 niche site, a $90,000 supplement store and a $200,000 Amazon brand would all land on the same 2.42x median. Only the 29 businesses earning over $250,000 broke away, at 3.25x. Funds and operators with teams tend to buy at that size, and not many listings are big enough for them. Below it, many buyers use SBA 7(a) loans, which under SBA's rules in force from October 1, 2026 need at least 10% of total project costs in buyer equity for a business acquisition.
More income streams, a higher multiple
Businesses earning from one source had a 2.50x median across all years. Two sources raised it to 2.67x. With three or more, such as a recipe site earning from display ads, an Amazon affiliate link set and its own ebook, the median reached 2.92x. On $60,000 of profit, that difference between one stream and three is about $25,000.
Owner hours made little difference. Since 2024, businesses run on five hours a week or less were listed at 2.50x, and those needing more than 10 and up to 20 hours at 2.67x. The larger businesses in the data needed more hours and also commanded higher multiples, so the hours alone don't push the price down much.
Reading your own number off these tables
Start with the median for your business type in the 2024 to 2026 table, then move it with the age, size and income-stream patterns above.
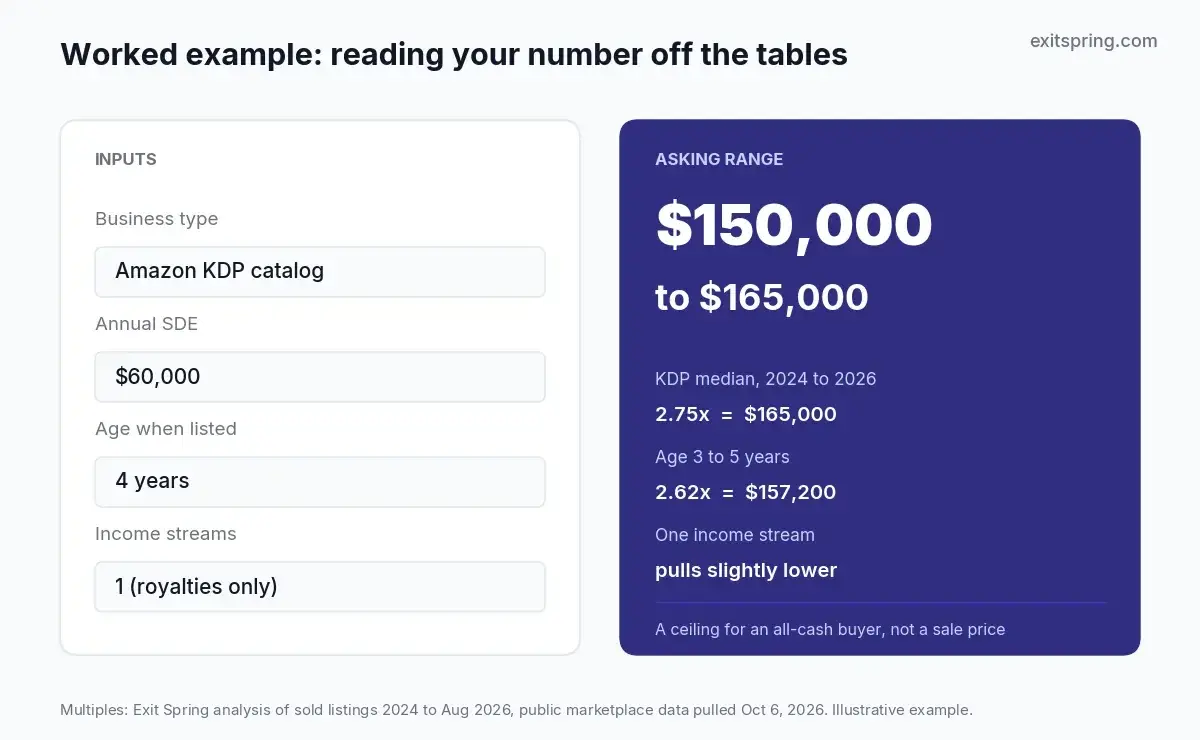
Say you run a four-year-old Amazon KDP catalog with $60,000 of SDE, all from royalties. The KDP median of 2.75x puts the asking price at $165,000. At four years old, the age pattern points nearer 2.62x, or $157,200. A single income stream pulls slightly lower again. A reasonable asking range is $150,000 to $165,000, and the final price can come in below that, since every figure here is a ceiling for an all-cash buyer.
A seller of a $70,000-a-year candle brand who asks 3.4x, well above the 2.50x ecommerce median, should expect buyers to ask them to justify it. A screen share of three years of Shopify payouts can do that. So can a trademark registration with a few thousand monthly searches for the brand name. Without something like it, the price is open to change at the marketplace's monthly price review, and our next study measures how many months that takes.
For a figure built on your own accounts rather than a median, send us your numbers for a valuation. We'll tell you where your business sits against these 2,667 sales and which of the factors above are holding it back.
How the data was pulled
Pulled from the marketplace's public listings feed on October 6, 2026.
| Item | Detail |
|---|---|
| Listings pulled | 2,678 sold, 174 for sale |
| Dropped | 11 sold listings with no listed price, no positive profit figure, or a multiple under 0.3x or over 10x |
| Used | 2,667 sold listings |
| Multiple | The marketplace's annual asking multiple on SDE |
| Business type | First income source named on the listing |
| Year | Year first listed (listed December 2025, sold March 2026 counts as 2025) |
| 2026 cut-off | Listings up to August 7, 2026 |
| Not in the feed | Final sale price, earnouts, seller financing |
| Reading the figures | As a ceiling: under the marketplace's terms, the listing price is the most a cash buyer can pay |
Sources
- Empire Flippers, public marketplace listings data (2,678 sold listings, retrieved October 6, 2026) and Terms of Use, effective November 8, 2025 (listing price as the all-cash maximum)
- BizBuySell, 2025 year in review, January 30, 2026 (closed transactions, average cash-flow multiple, median sale price)
- Marketplace Pulse, Amazon aggregators raised over $12 billion in 2021, December 9, 2021
- Marketplace Pulse, The Amazon aggregator is dead, January 31, 2024
- Federal Reserve, FOMC statement, March 15, 2020
- CNBC, Amazon slashes commission rates for affiliate program, April 14, 2020
- Google, New ways we're tackling spammy, low-quality content on Search, updated April 26, 2024
- U.S. Small Business Administration, SOP 50 10: Lender and Development Company Loan Programs (version 8.1, effective October 1, 2026)
- Google Search Status Dashboard, ranking update history
Get new listings in your inbox
Fresh businesses for sale every Monday, plus practical buying and selling tips.
Unsubscribe anytime. No spam.
Keep reading



Ready to make a move?
Browse vetted online businesses or get a free valuation of yours.