
How Long Does It Take to Sell an Online Business? (2026 Data)

In 2020, a typical online business listed on one of the largest US marketplaces for websites and online stores found its buyer in 17 days. A business listed in 2025 typically waited 96. Of the 194 businesses first listed that year, 30 were still for sale when we pulled the data on October 8, 2026, and every one of them had been on the market for more than 300 days.
We counted every sold listing in the marketplace's public feed back to 2014, 2,679 in all, and measured how many days each one spent on the market. Then we added the time on either side: the review before a listing goes live, and the handover after a buyer commits. The feed also records each business's profit trend, age, size, income sources, product count and the month it went live, so we could test which of those actually moved the wait.
For what these same businesses were listed at, see online business valuation multiples by business type. This study uses the same feed, pulled two days later.
Three stages, and the market is only one of them
Sellers tend to quote the time on the market as "how long it took to sell". It's the longest stage, but it sits between two others.
| Stage | What happens | Typical length since 2024 |
|---|---|---|
| Review | The broker checks the financials and access before the listing goes live | 24 days (median) |
| On the market | Buyers see the listing, ask questions, book calls and make offers | 66 days (median, sold listings) |
| Handover | The buyer pays into escrow, accounts and assets move, funds are released | 2 to 8 weeks |
Added together, a median sale runs about three and a half to five months from submission to the end of the handover.
About 24 days of review before any buyer sees it
A business doesn't go live the day the seller submits it. For listings since 2024 that went on to sell, the median gap between a listing record being created and the listing going live was 24 days. A quarter got through in 13 days or fewer. A quarter took 44 days or more.
The feed doesn't say what held the slow ones up. These are the documents we ask for first, and the hold-up each one heads off.
| Send before you submit | What it heads off |
|---|---|
| 24 months of monthly profit and loss | A reviewer rebuilding your numbers from bank statements |
| Stripe, PayPal, Shopify Payments, Amazon or AdSense payout reports for the same months | A P&L that can't be matched to cash received |
| Staff or read-only logins for analytics, the store and ad accounts | A week of back-and-forth over access |
| Every recurring cost, with the supplier or tool named | Add-backs being questioned one by one |
| A note on the March traffic dip, the supplier switch, the policy warning | The same question asked three times |
Count back from the day you want buyers looking. For June 1, a median review means submitting around May 8. A slow one means mid-April.
Median days on the market, 2019 to 2025
| Year first listed | Sold listings | Median days to sell | Sold within 30 days |
|---|---|---|---|
| 2019 | 260 | 29 | 51% |
| 2020 | 307 | 17 | 63% |
| 2021 | 377 | 24 | 54% |
| 2022 | 296 | 44 | 40% |
| 2023 | 159 | 58 | 35% |
| 2024 | 163 | 67 | 22% |
| 2025 | 164 | 74 | 22% |
With unsold listings counted as still waiting:
| Year first listed | Listings | Still for sale on Oct 8, 2026 | A quarter sold by | Half sold by |
|---|---|---|---|---|
| 2024 | 164 | 1 | Day 32 | Day 67 |
| 2025 | 194 | 30 | Day 45 | Day 96 |
| 2026 | 210 | 145 | Day 70 | Not reached yet |
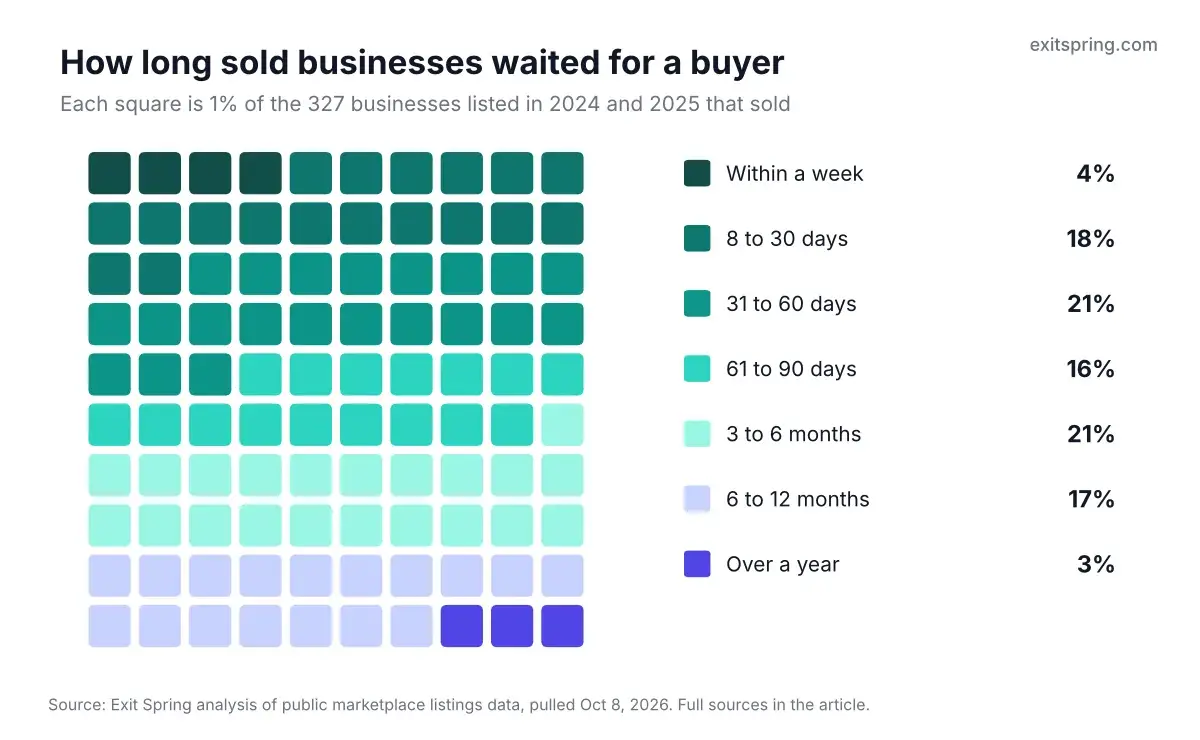
Twelve of the 327 sold in their first week. Eleven needed more than a year, and one, listed in 2024, went after 833 days.
Other sources put the full sale at five to seven months
Our figures stop when a listing is marked sold. Two other sources measure further along, to the day a deal actually closes.
| Source | What it counts | Figure |
|---|---|---|
| This study, businesses listed in 2025 | Median days from listing to sold, unsold listings counted as still waiting | 96 days |
| BizBuySell 2025 year in review, 9,586 closed small business sales | Median time to close | 170 days (166 in 2024) |
| Flippa's guide to selling timelines, updated October 2025 | Median across common categories, listing to close (no sample size given) | 200 days |
| The same Flippa guide | Due diligence on small and mid-size deals | 30 to 90 days |
BizBuySell's sales are mostly offline businesses such as restaurants, shops and service firms. Its restaurants took a median 189 days and manufacturers 223, so a $300,000 HVAC company and an $80,000-a-year Amazon brand sit at different points on the same curve. Add our 24-day review and a typical handover to the 96 days, and an online sale lands around 135 to 175 days from submission to money released, close to the BizBuySell median.
57% of sales ran past the initial two-month exclusive period
Sellers on this marketplace grant it the exclusive right to sell their business for two months from the listing date, and that exclusivity carries on for as long as the business stays listed. Of the 2024 and 2025 businesses that sold, 57% were still on the market when the first two months ran out.
Day 61 doesn't free a seller to go elsewhere. The terms say a seller can't cancel the listing term except as the agreement provides, and a sale to a buyer the marketplace introduced still owes it commission for a year after the term ends. A seller who did move would face a second review, a new listing and a fresh start on the day count, a median of more than three more months somewhere else.
Picture a seller who put down a deposit on a new venture in April, counting on a 60-day sale, and is still taking calls in July with a payment due. Buyers notice that. Budget for day 96.
By business type, 41 to 84 days
Sold listings from 2024 onward, types with at least ten sales:
| Business type | Sold since 2024 | Median days | A quarter sold within | A quarter waited over |
|---|---|---|---|---|
| YouTube | 29 | 41 | 21 days | 88 days |
| Affiliate | 12 | 57 | 42 days | 151 days |
| Agency | 11 | 58 | 21 days | 132 days |
| Ecommerce (own store) | 34 | 60 | 19 days | 121 days |
| SaaS | 13 | 60 | 16 days | 87 days |
| Amazon KDP | 27 | 62 | 32 days | 98 days |
| Dropshipping | 18 | 63 | 38 days | 110 days |
| Amazon FBA | 148 | 70 | 29 days | 158 days |
| Subscription | 10 | 75 | 35 days | 191 days |
| Amazon Merch | 13 | 81 | 21 days | 139 days |
| Display advertising | 43 | 84 | 25 days | 144 days |
YouTube channels sold fastest and also carried the lowest multiples in our valuation study, a median of 2.0x. A $40,000-a-year channel at that multiple asks $80,000, an amount many individual buyers can pay from savings without lining up a loan or a partner. How much is a YouTube channel worth explains why channels price where they do.
Recipe blogs and other ad-funded sites earn from Google visitors. After the March 2024 core update, which Google says cut low-quality, unoriginal content in results by 45%, expect buyers of these sites to ask for Search Console exports covering every month since.
Amazon FBA brands had the widest spread of any type with more than 20 sales. A quarter sold within a month, and a quarter took more than five. With 148 sales they are also the most reliable row in the table, and the feed records how many SKUs each one carried. Brands with 20 or fewer SKUs sold in a median 60 days. Brands with 21 to 60 SKUs took 102, probably because each extra product line is one more set of supplier terms, reorder points and inventory counts for a buyer to price before offering.
Rising profit cut the wait to 57 days
The feed records each business's net profit trend, as a percentage, usually over the previous twelve months. Grouped by that trend, the gap between growing and shrinking businesses was clear.
| Profit trend, usually last 12 months | Sold since 2024 | Median days | Waited over 6 months |
|---|---|---|---|
| Down 20% or more | 112 | 73 | 22% |
| Down 5% to 19% | 36 | 92 | 28% |
| Flat (down 4% to up 5%) | 38 | 61 | 24% |
| Up 6% to 20% | 36 | 91 | 19% |
| Up more than 20% | 170 | 57 | 8% |
Read the top and bottom rows; the three in the middle have under 40 sales each and jump around. Among the 170 growing fastest, 8% waited past six months. Among the 112 shrinking fastest, 22% did.
Picture a Shopify store whose profit fell from $9,000 a month to $6,500. The first buyer call is about why. The second is about whether it has stopped. A falling business is often priced lower for it, and in this data the falling ones still sat longer.
An owner whose profit went from $6,500 up to $9,000 has a reason to list this quarter, while that line still points up.
Size, age and owner hours
| Annual profit | Sold since 2024 | Median days to sell |
|---|---|---|
| Under $25,000 | 53 | 64 |
| $25,000 to $50,000 | 120 | 59 |
| $50,000 to $100,000 | 101 | 71 |
| $100,000 to $250,000 | 87 | 80 |
| Over $250,000 | 31 | 84 |
Above $50,000 a year, add two to four weeks. A $35,000-a-year print-on-demand store is a purchase one person can decide on in a weekend. At $180,000 a year the asking price passes $400,000, and the buyer is often using an SBA loan, a fund or two partners who all need to sign off.
SBA money has cost more since 2022. The Federal Reserve raised its target rate to 5.25% to 5.5% in July 2023, and SBA 7(a) loans are usually priced off the prime rate. The Fed cut from September 2024, then raised the range by a quarter point to 3.75% to 4% on September 16, 2026. The SBA's lending rules for applications from June 1, 2025 required buyers of a business to put in at least 10% equity, with a seller note counting toward that only if it sits on full standby for the life of the loan, and for no more than half of it. SOP 50 10 8.1, which applies to loans given an SBA loan number from October 1, 2026, moves the change-of-ownership rules into a new appendix and keeps the 10% minimum for a first acquisition. On a $400,000 purchase, that's $40,000 the buyer has to find before the bank will move.
Businesses under two years old sold fastest of any age group, in a median 43 days. They were also the cheapest, at a 2.21x median multiple. Every age band from two years up took between 63 and 82 days, with no steady pattern across them.
Owner hours pointed the same way as size. Businesses run on five hours a week or less sold in a median 59 days. Those needing more than 20 hours a week took 79. Much of that overlaps with size, since the bigger businesses in the data are the ones with more work attached.
Income streams pointed the same way, though not because of size: the sites with three or more streams earned no more than the single-stream ones. Businesses with one source of income sold in a median 59 days, and those with three or more took 74. A woodworking site earning from YouTube ads, affiliate links to tools and its own paid plans needs each of those checked separately.
Listings that went live in January and June sold fastest
We grouped every business sold since 2022 by the month it first went live.
| Month listed | Sold since 2022 | Median days to sell |
|---|---|---|
| January | 95 | 44 |
| February | 95 | 54 |
| March | 94 | 66 |
| April | 75 | 55 |
| May | 81 | 59 |
| June | 63 | 38 |
| July | 67 | 50 |
| August | 65 | 64 |
| September | 59 | 74 |
| October | 62 | 72 |
| November | 43 | 59 |
| December | 48 | 56 |
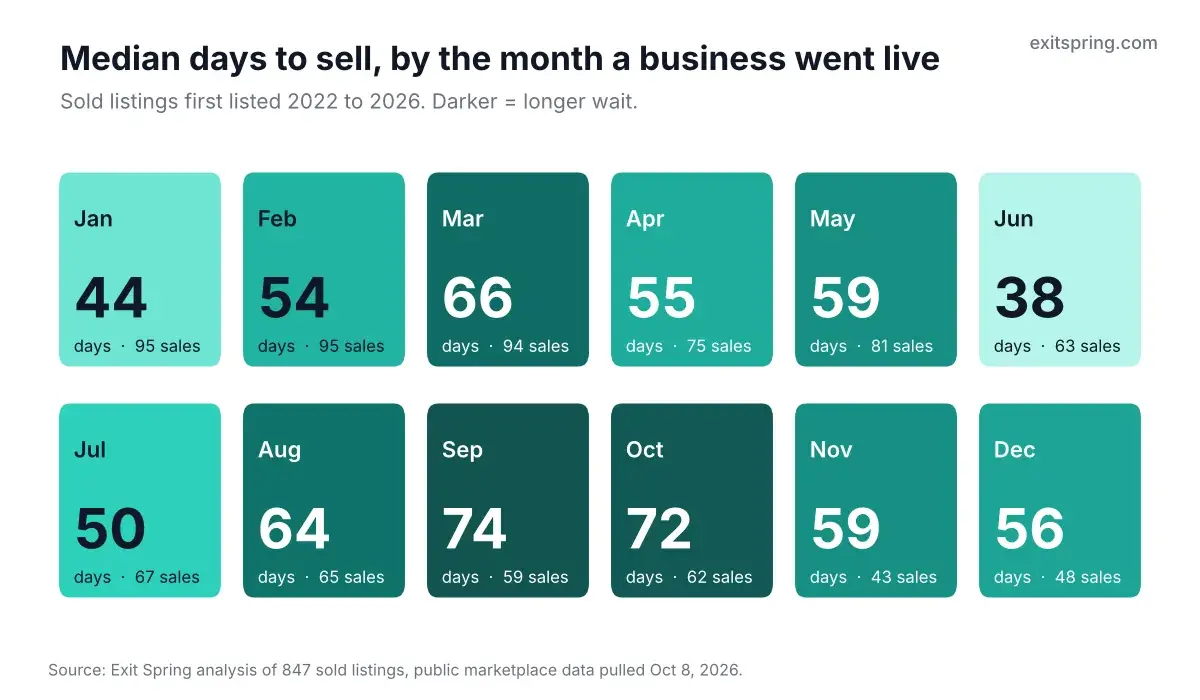
Of the September listings that sold, 27% took more than six months. An FBA buyer looking in September would be paying for the business and for fourth-quarter stock at once, which could be part of it. Each month holds 43 to 95 sales, and three or four slow ones can shift a median by two weeks. A seller with a free choice of start date has done better since 2022 going live in January or June.
Cheaper listings sat longer, and price cuts likely explain it
Since 2024, listings asking 10% or more below the median multiple for their business type took a median 103 days to sell. Listings asking more than 10% above it sold in 46.
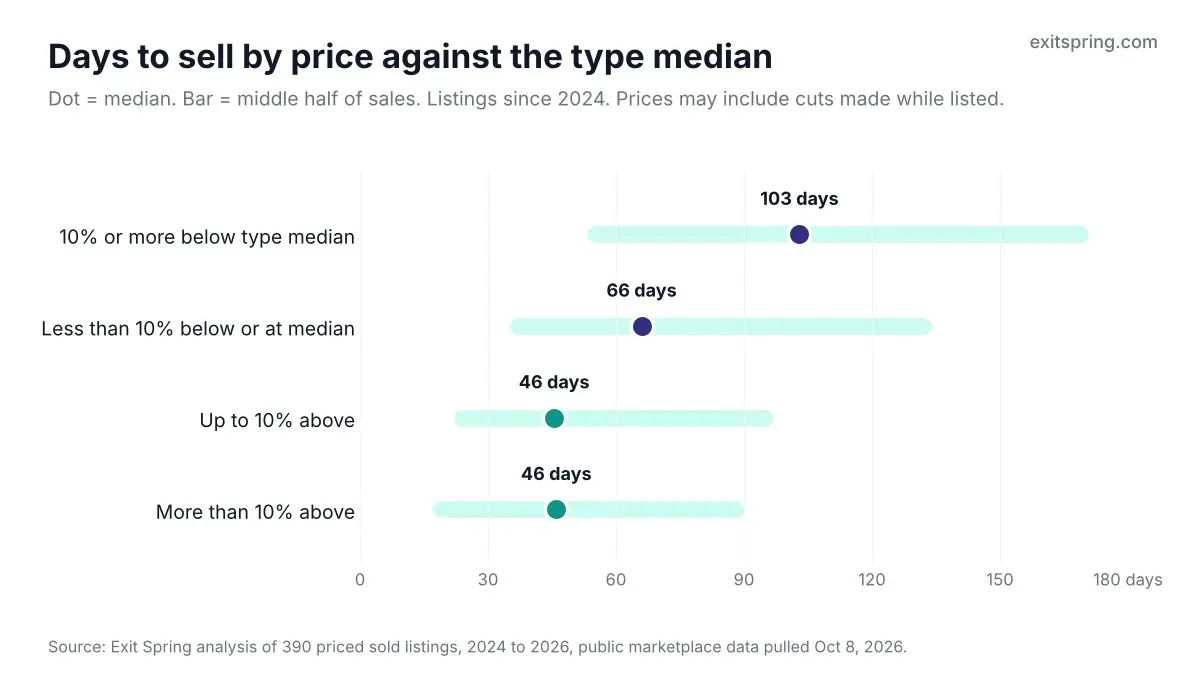
The feed gives one multiple per listing, and the marketplace reviews prices roughly once a month. A store that went live at 3.0x, waited 60 days and was cut twice would show up in our data as a slow sale at a low multiple. Most of the cheap, slow listings are probably businesses that started high.
Of the businesses listed since 2024 that sold at 10% or more under their type's median, fewer than half went within three months. Our valuation study has the type medians to check an asking price against before the listing goes live.
What's still on the market right now
On October 8, 2026, the marketplace had 176 businesses for sale. Their median time listed so far was 105 days. Fifty-four had been listed for more than six months, and 23 for more than a year.
Amazon FBA stores made up 71 of the 176, with a median of 110 days listed so far. A buyer browsing today sees a lot of FBA brands that have been waiting a while, which gives that buyer room to negotiate and adds to the competition any new FBA listing faces. Ecommerce stores on their own domains were next at 27 listings, then YouTube channels at 15.
After the offer: due diligence and the handover
The feed's day count stops when a listing is marked sold. Three steps come after it.
| Step | What the buyer does | What stretches it |
|---|---|---|
| Due diligence | Logs into Stripe, Shopify or Seller Central and checks the figures against the listing | Answers that take the seller two days instead of two hours |
| Escrow | Wires the purchase price to an escrow company | A buyer or seller outside the US, extra ID checks |
| Migration | Receives the domain, hosting, accounts, stock and supplier contacts | Amazon stock in FBA warehouses, suppliers who need to meet the new owner |
The marketplace's terms of use put the migration at two to eight weeks, and say it can run substantially longer. A WordPress site on its own hosting sits at the short end. A 40-SKU Amazon brand with two suppliers in Shenzhen is more likely to need the full eight weeks. Amazon generally doesn't let seller accounts change hands outright; the seller asks Amazon to update the legal entity, and removal orders to move the stock alone take 10 to 14 days at minimum, according to Flippa's Amazon transfer guide.
Escrow adds its own clock at the end. On Escrow.com, buyer and seller agree an inspection period of 1 to 30 calendar days, starting when the buyer marks the business as received. The seller is paid when the buyer accepts or the period runs out. A 10-day inspection on our FBA example below adds a week and a half after the last login is handed over.
Buyers usually work from a list like our due diligence checklist. Sellers paid outside the US should read selling an online business from outside the US before the wire is due.
Worked example: an FBA brand submitted March 1, finished by late July
| Stage | Typical length | Date reached |
|---|---|---|
| Submitted: $80,000 a year in profit, 12 SKUs | March 1 | |
| Review before listing | 24 days | March 25: goes live |
| On the market (FBA median since 2024) | 70 days | June 3: buyer agrees to buy |
| Due diligence, escrow and handover | 2 to 8 weeks | June 17 to July 29: handover done |
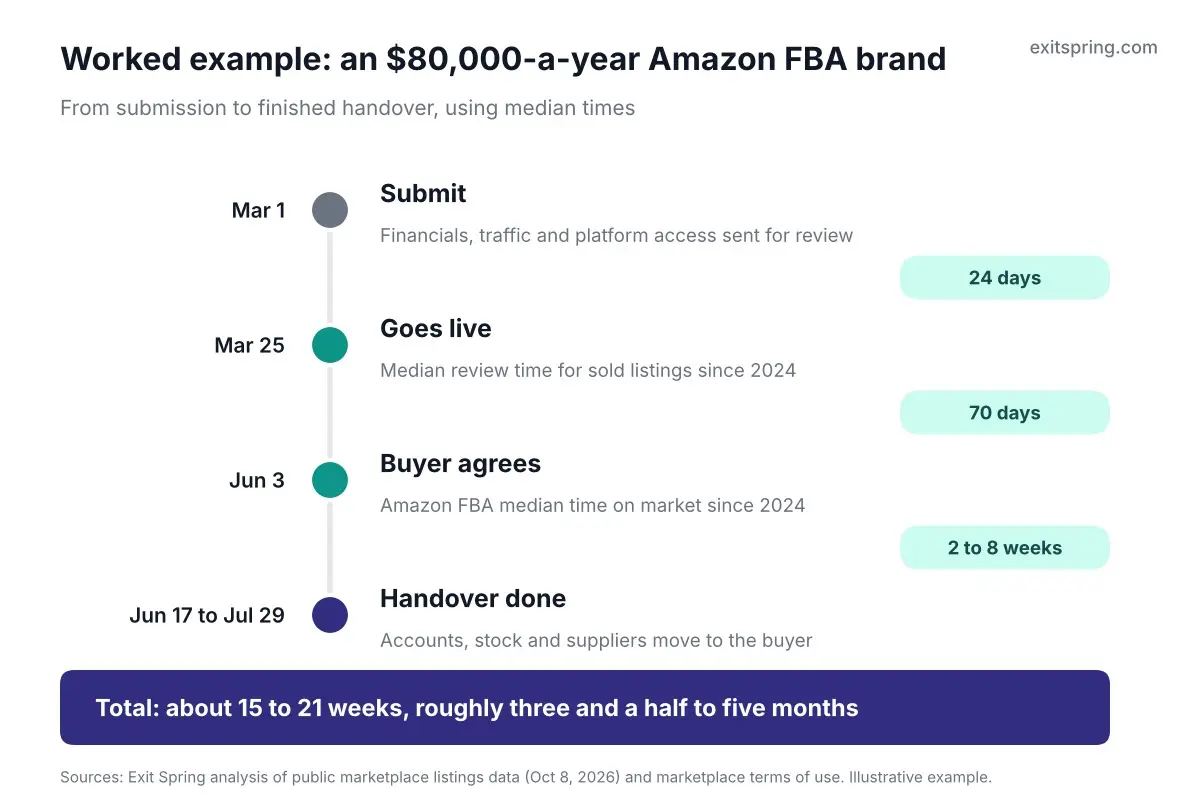
Had this brand been among the slowest quarter of FBA listings, at 158 days or more on the market, the handover would have finished between September 13 and October 25.
Now move the start date to September and give the brand a 20% profit drop. It lands in the slowest row of the month table and in the shrinking-profit rows of the trend table at the same time.
If your business hasn't sold by day 90
About two in five of the 2024 and 2025 businesses that sold were still listed at day 90. Roughly half of those went in the following three months, and the rest waited longer.
The listings that passed six months had two things in common more often than the rest. Of the businesses listed since 2024 that waited over 180 days, 52% had profit falling 5% or more, against 37% of all sales. And 63% sold below their type's median multiple, against 47% overall, which fits the price-cut pattern above.
| Where you are at day 90 | Move | Example |
|---|---|---|
| Asking above your type's median, profit flat | Cut to the median at the next monthly review | A 3.1x KDP catalog dropping to 2.75x |
| Profit rising | Add the latest month and let the trend update | September up 9% on August, now in the listing |
| Same three questions on every buyer call | Answer them in writing inside the listing | A page on why ad spend doubled in Q2 |
| Profit falling, no need for the money this year | Take it down, fix the cause, relist with two or three better months | A supplement brand that lost its best-selling flavour, back after a reformulation |
To check your price before you list, send us your numbers for a valuation. We'll compare your asking price to the 392 sales since 2024 and tell you how long businesses like yours have been taking.
How we worked out the numbers
Pulled from the marketplace's public listings feed on October 8, 2026.
| Item | Detail |
|---|---|
| Listings pulled | 2,679 sold, 176 for sale |
| Days on market | The feed's own days-on-marketplace figure for each listing |
| Review time | Days from listing record created to first listed, sold listings, 2024 onward |
| Year and month | Year and month first listed |
| Unsold listings | Counted as still waiting in the 2024 to 2026 survival table (survival method); left out of the sold-only tables |
| Business type | First income source named on the listing |
| Profit trend | The feed's net profit trend percentage, mostly over 12 months |
| SKUs | The feed's Amazon SKU count, FBA listings only |
| Price position | Listing multiple divided by the median multiple for its type, 2024 onward |
| Not in the feed | Listings withdrawn without selling, offer dates, the date money changed hands |
| What that means | Every figure here describes businesses that sold or are still listed. Ones taken down unsold would make the real waits longer |
Sources
- Empire Flippers, public marketplace listings data (2,679 sold and 176 for-sale listings, retrieved October 8, 2026) and Terms of Use, effective November 8, 2025 (exclusive listing term of two months and for as long as the business stays listed, one-year commission tail, monthly price review, two to eight week migration)
- BizBuySell, 2025 year in review, January 30, 2026 (median time to close, closed transactions, time to close by sector)
- Flippa, How long does it take to sell a business, updated October 15, 2025
- Flippa Help Center, transferring an Amazon seller account
- Escrow.com, What is an inspection period
- Google, New ways we're tackling spammy, low-quality content on Search, updated April 26, 2024
- Federal Reserve, FOMC statement, July 26, 2023
- Federal Reserve, FOMC statement, September 16, 2026
- Whiteford, SBA issues SOP 50 10 8: key changes impacting SBA 7(a) lending
- SBA Information Notice 5000-880695, Issuance of SOP 50 10 8.1, effective October 1, 2026
Get new listings in your inbox
Fresh businesses for sale every Monday, plus practical buying and selling tips.
Unsubscribe anytime. No spam.
Keep reading



Ready to make a move?
Browse vetted online businesses or get a free valuation of yours.